CSS Visual Rules in Chrome Inspector
Using Chrome DevTools for CSS Visual Rules
Requirements:
- An Internet browser
Introduction
Browser developer tools allow web developers to quickly collect important information on most websites. These tools are available within most major web browsers, like Chrome, Safari, and Firefox, to name a few. Because Google Chrome is the preferred browser for many professional developers, we’ll learn how to use the browser developer tools within Google Chrome, known as Chrome DevTools.
Step 1: Accessing DevTools
The quickest way of accessing DevTools in Chrome is to navigate to any website (like this one) and right click (press control and click for a single button mouse) anywhere on the page. Upon doing so, a menu will appear directly beside the area you clicked on. In the menu, select “Inspect.” This will automatically launch DevTools within your browser. DevTools will appear as a window on either the bottom or right-hand side of your screen. It should look something like this:
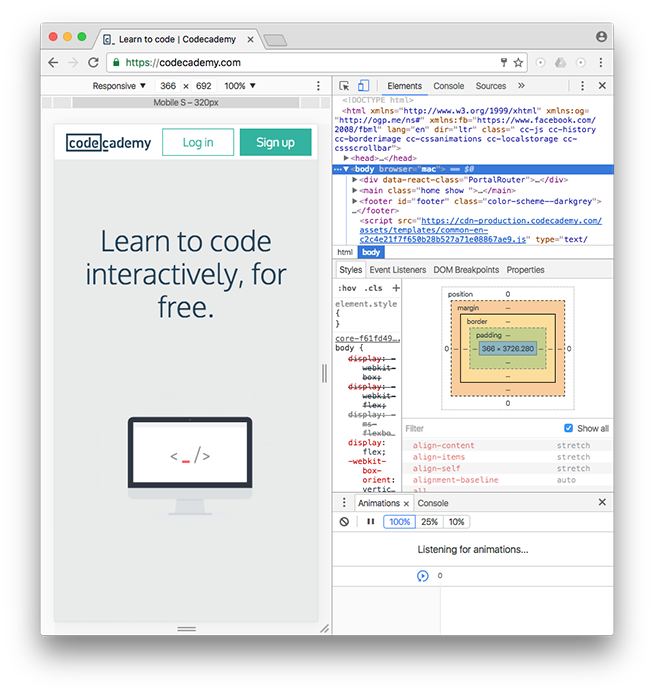
You should see the Elements, Console, Sources, and Network tabs, among many others.
This rest of this article will focus exclusively on the Elements tab.
Step 2: Using DevTools to View CSS Styles
DevTools can provide you with a lot of information about a website, but it’s particularly exceptional at examining a page’s HTML elements, along with the CSS styles for those respective elements. Let’s try it out!
1. Open an incognito Chrome browser (in the browser’s menu, click on “File” then “New Incognito Window”). This will allow you to read this article while completing the following steps.
2. Navigate to Codecademy’s homepage (make sure you are logged out).
3. Right click (or control and click simultaneously) on any text on the page. (This article uses screenshots from a previous version of the Codecademy home page. Your home page may look different from the one shown in the screenshots.)
4. Select “Inspect” in the menu that appears.
5. DevTools should appear at the bottom of your page (it’s normal if its appears in another location, as its location can be changed).
6. Click on the “Elements” tab of DevTools (if you’re not already on it).

7. In the left pane, notice the interactive DOM (HTML elements) that contains the current content of the web page.
8. Mouse over the HTML code — as you mouse over, notice that DevTools will highlight the corresponding HTML element on the web page.
9. Note that you can expand closed elements by clicking the arrow directly to the left of them.

10. Alternatively, click the “Select element” icon (shown in the image below) in the top-left corner of the console and then click on an element within the web page — this is a much quicker way of accessing a specific element on the web page that you want to inspect.

11. On the right hand side of DevTools, click on the tab named Styles (if you’re not already on it) — this tab displays all of the CSS styles associated with the element highlighted in the left side of DevTools.
12. Scroll down in the Styles tab, notice that some CSS styles are crossed out with a horizontal black line.

13. Remember, the Styles tab shows all styles applied to that element (rules can often be overwritten by more specific rules, which causes the horizontal black line through some CSS rules, denoting that that rule is not being used).
14. To instead view only the styles applied to that specific element, click on the Computed tab directly next to the Styles tab in the right pane. In this pane, you will see only the styles that are being applied to that element, also known as the computed styles. (If the Computed tab is not appearing for you, your browser may be sized too small. Expand the width of the browser until it appears.)

Step 3: Modifying CSS Styles with DevTools
DevTools is also useful for modifying existing CSS rules and previewing those changes directly on the page you’re viewing.
To try it out, click again on the Styles tab in the right pane of DevTools (feel free to use the Codecademy website again). Scroll down to a CSS rule (one that is not crossed out with a black line), click on the value of any applied CSS rule, change the value, and press enter on your keyboard. You should see the change automatically update on the page.

There are a few things to keep in mind when using DevTools to modify a web page:
1. When you modify or change a CSS rule, you may be affecting more than one element.
2. DevTools provides easy-to-use tools when you modify certain CSS rules. (For example, when modifying color values, DevTools will provide you with a color picker to help you select a color.)
3. DevTools is only a sandbox tool, meaning that any changes you make to the web page will not be saved, so make sure to write down any changes you’d like to make when using DevTools for your own web page!
Step 4: Add CSS Styles with DevTools
In addition to modifying existing CSS rules, you can add new CSS rules as well. Let’s continue using DevTools on the Codecademy homepage.
1. Locate some text on the home page (i.e. find a heading, paragraph, link, etc.).
2. Right click on the text and click “Inspect” in the menu that appears. DevTools will highlight the corresponding HTML element in its left pane.
3. Take a look at the Styles tab and click on the + icon in the top-right corner of the right pane — notice that this creates a new, empty CSS rule for that element.
4. Within the element’s selector, click and add a new CSS declaration. The following is an example (feel free to add your own declaration):
background-color: red;
You should see the background color of the text you selected change to red. You can also continue to add your own CSS styling as you wish.
In the future, try this technique on your own website(s) as you build them from the ground up. Building with DevTools can result in a more efficient workflow, as it can help you avoid repeatedly saving and viewing changes manually.
Step 5: Modify HTML with DevTools
DevTools also lets you directly modify the HTML content of a web page. Let’s try this out one more time on the Codecademy homepage.
1. Again, right click on a piece of text on the homepage and click “Inspect” in the menu that appears.
2. DevTools will automatically highlight the HTML code in the left pane associated with the content that you inspected on the web page.
3. In DevTools, double click on the text between the opening and closing tags of the text you right-clicked on.
4. Change the heading to say something else, like your name, or “Codecademy”, and press enter.

At this point, you should see the text change!
You can also add HTML of your own as well. Let’s add an <h2> element directly below the element you just modified.
1. Right click on the element you just modified, a menu should appear. Click on “Edit as HTML.” (You can also delete elements using this menu.)
2. A large text field should appear. Directly edit the HTML by adding an <h2> element below with the text of your choice.
3. To complete/view your changes, click on any other element in the left window pane or press command and enter at the same time (on a Mac keyboard).
What happens to the web page? Remember, these are sandboxed changes, so your changes will not be saved, nor permanently affect the website you are applying changes to.
Review
The Chrome web browser provides you with robust web developer tools known as DevTools. With DevTools, you can view a web page’s existing DOM elements and associated styles, as well as modify and preview changes you make to the web page, resulting in an efficient workflow. If you’re interested in learning more about DevTools, visit the official documentation at https://developer.chrome.com/devtools.
Happy coding!

