React Developer Tools
Introduction
Effectively debugging applications is a cornerstone of programming. After creating a React App, an important next step is setting up your environment to debug it. We’ll cover the basics in this article using the initial skeleton created by using create-react-app.
This article assumes you are familiar with create-react-app and Chrome DevTools. We’re also going to be briefly touching on state and props within a component, so it’s best if you have a basic understanding of these concepts before proceeding with this article!
We’ve included this article in video form too. You can watch here or scroll down to keep reading!
1. Install React Developer Tools
Facebook created a Chrome extension to help with debugging React Apps. It is called React Developer Tools and allows developers to inspect React components, view their properties, and interact with them while looking at the application in Google Chrome. You can add this functionality to Chrome by navigating to the extension page here, selecting “Add to Chrome”, and following the installation prompts.

2. Inspect React components
With the extension installed, if you start your React App (npm start) and visit the site in Chrome, the React Developer Tools icon in the Chrome menu bar should change from inactive:

to active:

This indicates that the site you are browsing is a React App in development build. When a page is using the production build of React, the icon will look like this:
![]()
To open the React Developer Tools, first open Chrome DevTools (View > Developer > Developer Tools). On the same banner as Elements, Sources, Console, etc., there will be two new React tabs: Components and Profiler. These two tabs will only appear on sites using React. (If they’re not visible, you’ll need to click on the arrow to expand the tabs selection.)
Click on the Components tab.
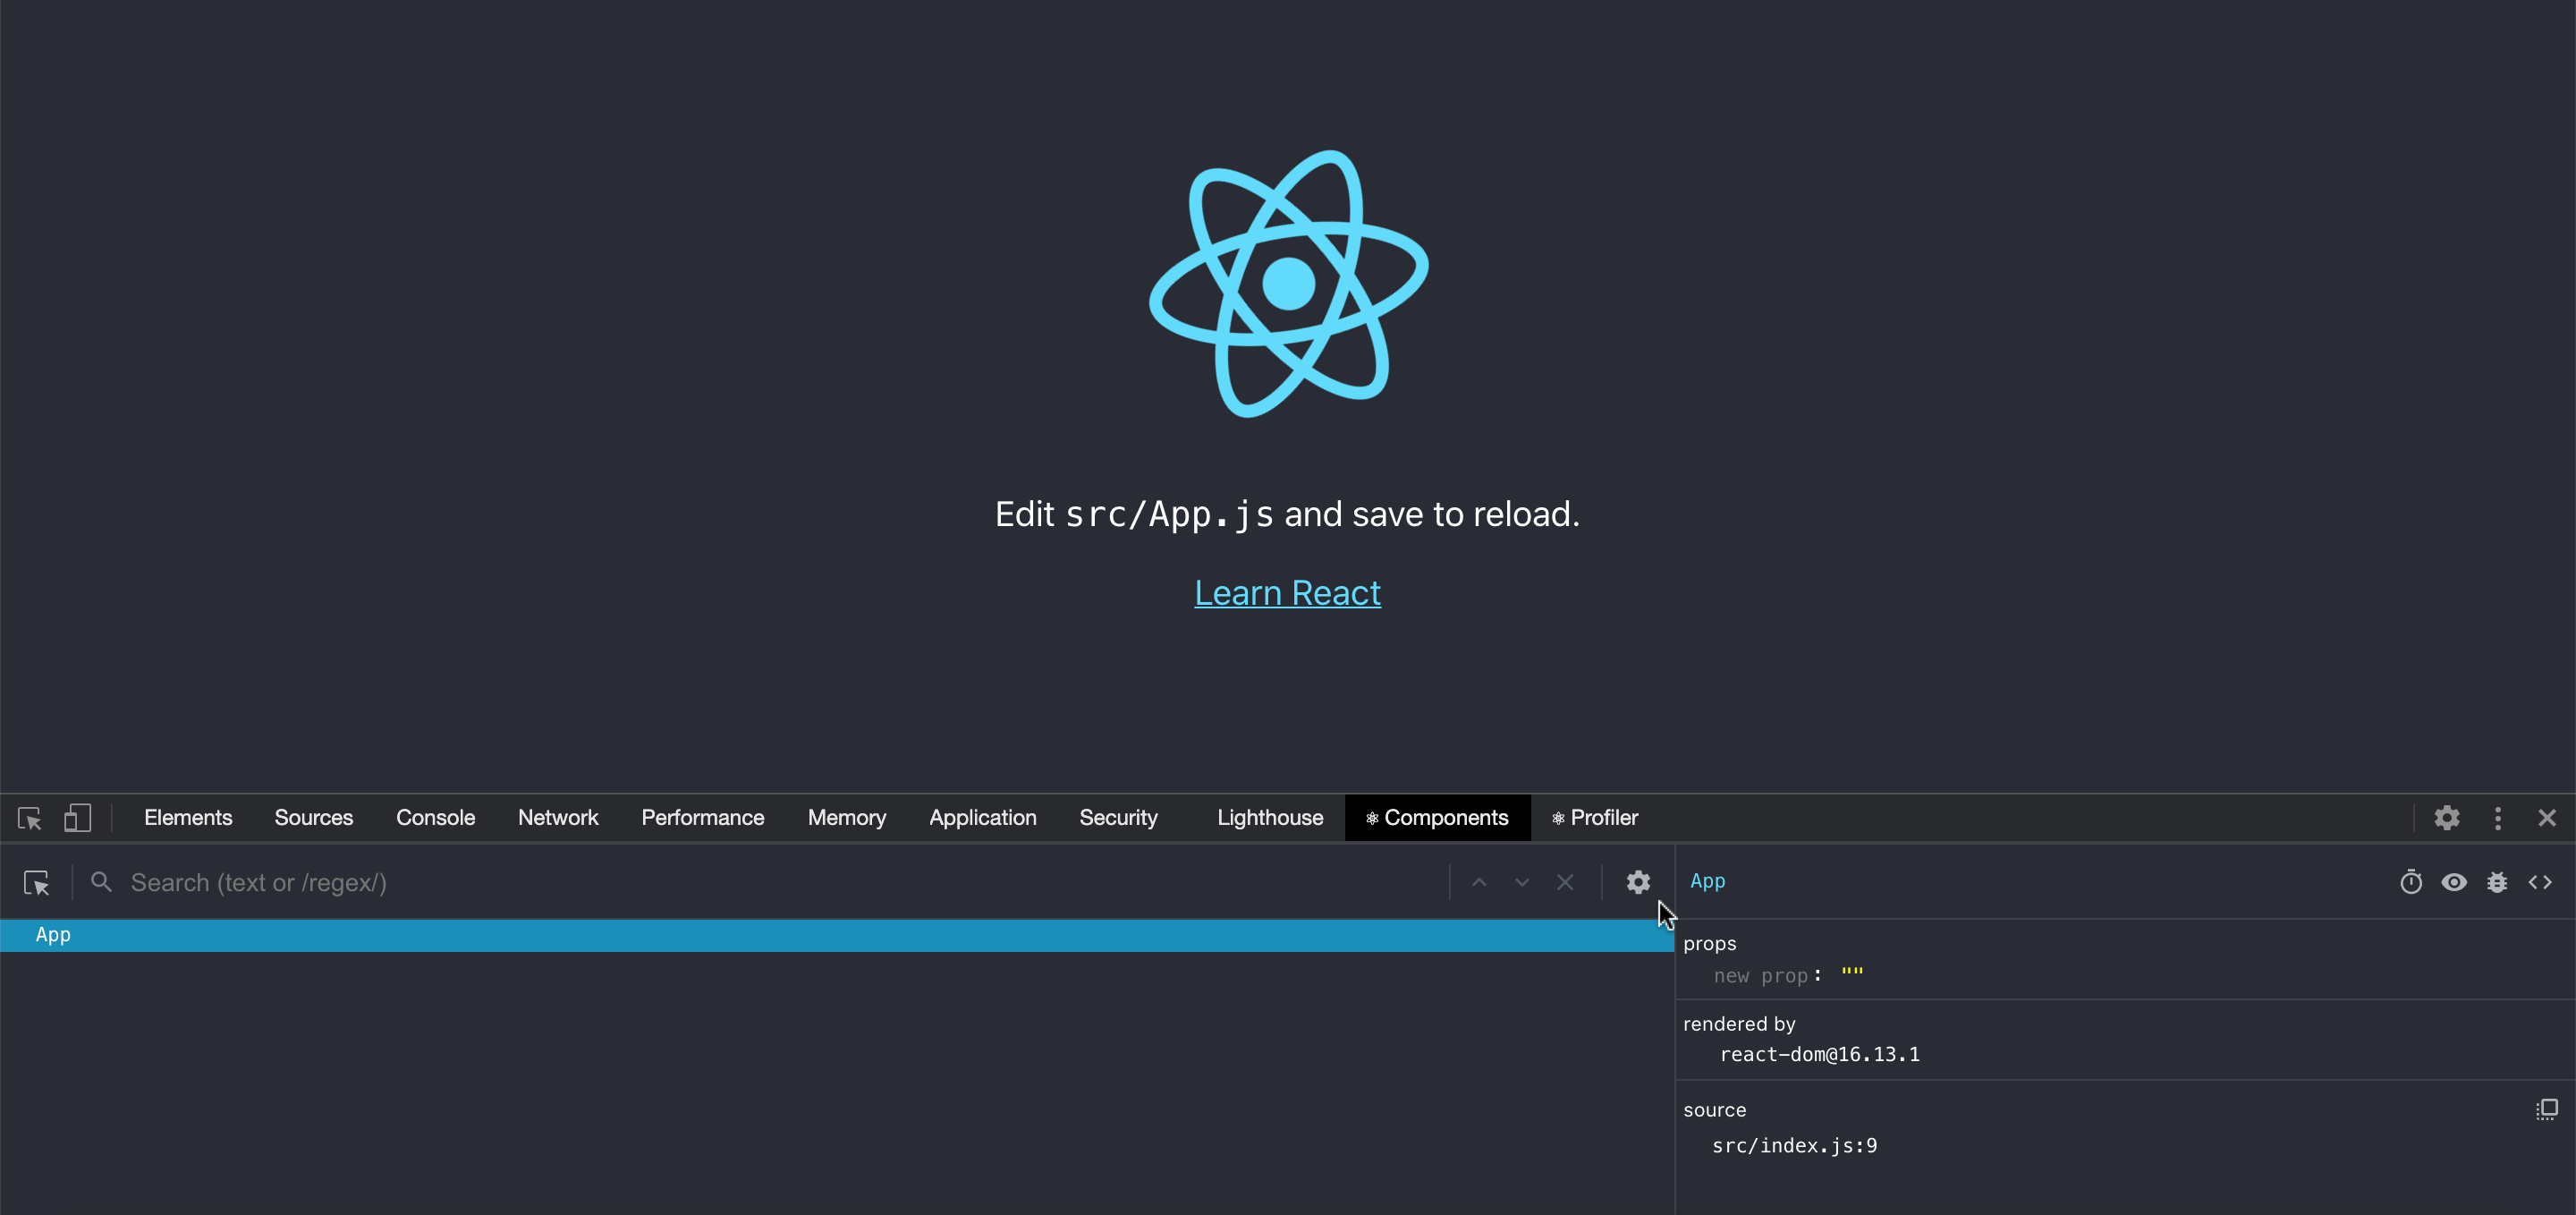
Right now, all we can see is App itself. But we want to see the contents of App as well!
In the above image, you’ll see that the cursor is pointing to a gear icon. Click the gear icon to open up the settings, and then click on the Components tab in the pop up window.

By default, there is a filter that is causing the host (DOM) nodes to be hidden. Delete this filter for now and then exit out of the settings window. You can always go back into settings and apply your preferred filters!
Now you will see a tree of App‘s contents! As you hover over the elements on the left, they are highlighted in the rendered view, similar to Chrome DevTools. If you click on the elements in the left side of the window, their properties are exposed on the right side. (If your Chrome DevTools appear vertically on the left/right side of the window, App and its contents will appear on top, and their properties will be exposed underneath.):

You can also use the search box to locate elements by name:

If you’ve played around with React Developer Tools before, you may notice that this looks a bit different than what you remember. If that’s the case, you may want to take a look at the official React documentation for what’s changed or how to get the old version back if you’re more comfortable with that.
3. Modify components with JavaScript
With React Developer Tools and the console, it is possible to modify rendered React components. This allows you to experiment with changing component values, calling methods, and testing interaction between components.
You can access and update a component’s state and props inside the Components tab. Click and edit the props and state from the right side. For state to show up, you’ll first need to initialize the component with some state from inside your files.

It works with React Hooks, too!

You can also do this by selecting the component, switching over to the console view, and accessing the component using $r. By logging $r, you could see that this was indeed the component selected.

With these tools you’re now ready to begin debugging React Apps!
For more details and practice on how to use the updated tools, check out this interactive tutorial!

