K Nearest Neighbors
Regression in KNN Algorithm
K-Nearest Neighbor algorithm uses ‘feature similarity’ to predict values of any new data points. This means that the new point is assigned a value based on how closely it resembles the points in the training set. During regression implementation, the average of the values is taken to be the final prediction, whereas during the classification implementation mode of the values is taken to be the final prediction.
K-Nearest Neighbors Underfitting and Overfitting
The value of k in the KNN algorithm is related to the error rate of the model. A small value of k could lead to overfitting as well as a big value of k can lead to underfitting. Overfitting imply that the model is well on the training data but has poor performance when new data is coming. Underfitting refers to a model that is not good on the training data and also cannot be generalized to predict new data.
KNN Classification Algorithm in Scikit Learn
Scikit-learn is a very popular Machine Learning library in Python which provides a KNeighborsClassifier object which performs the KNN classification. The n_neighbors parameter passed to the KNeighborsClassifier object sets the desired k value that checks the k closest neighbors for each unclassified point.
The object provides a .fit() method which takes in training data and a .predict() method which returns the classification of a set of data points.
from sklearn.neighbors import KNeighborsClassifierKNNClassifier = KNeighborsClassifier(n_neighbors=5)KNNClassifier.fit(X_train, y_train)KNNClassifier.predict(X_test)
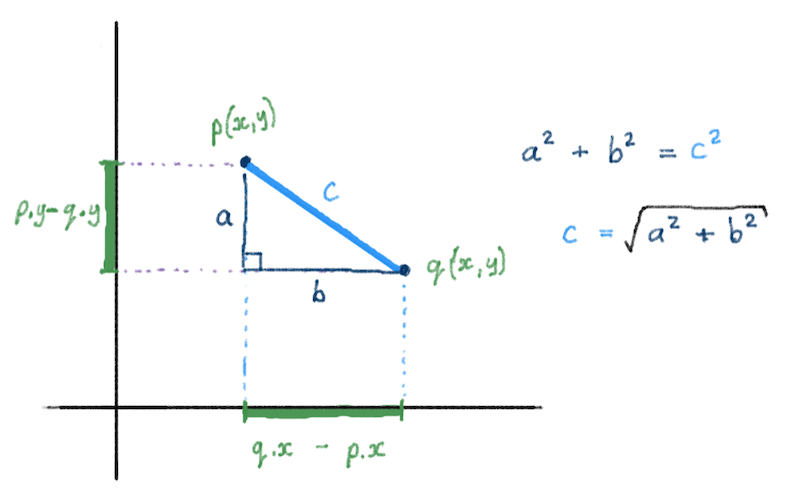
Euclidean Distance
The Euclidean Distance between two points can be computed, knowing the coordinates of those points.
On a 2-D plane, the distance between two points p and q is the square-root of the sum of the squares of the difference between their x and y components. Remember the Pythagorean Theorem: a^2 + b^2 = c^2 ?
We can write a function to compute this distance. Let’s assume that points are represented by tuples of the form (x_coord, y_coord). Also remember that computing the square-root of some value n can be done in a couple of ways: math.sqrt(n), using the math library, or n ** 0.5 (n raised to the power of 1/2).
def distance(p1, p2):x_diff_squared = (p1[0] - p2[0]) ** 2y_diff_squared = (p1[1] - p2[1]) ** 2return (x_diff_squared + y_diff_squared) ** 0.5distance( (0, 0), (3, 4) ) # => 5.0
Elbow Curve Validation Technique in K-Nearest Neighbor Algorithm
Choosing an optimal k value in KNN determines the number of neighbors we look at when we assign a value to any new observation.
For a very low value of k (suppose k=1), the model overfits on the training data, which leads to a high error rate on the validation set. On the other hand, for a high value of k, the model performs poorly on both train and validation set. When k increases, validation error decreases and then starts increasing in a “U” shape. An optimal value of k can be determined from the elbow curve of the validation error.
K-Nearest Neighbors
The K-Nearest Neighbors algorithm is a supervised machine learning algorithm for labeling an unknown data point given existing labeled data.
The nearness of points is typically determined by using distance algorithms such as the Euclidean distance formula based on parameters of the data. The algorithm will classify a point based on the labels of the K nearest neighbor points, where the value of K can be specified.
KNN of Unknown Data Point
To classify the unknown data point using the KNN (K-Nearest Neighbor) algorithm:
- Normalize the numeric data
- Find the distance between the unknown data point and all training data points
- Sort the distance and find the nearest k data points
- Classify the unknown data point based on the most instances of nearest k points
Normalizing Data
Normalization is a process of converting the numeric columns in the dataset to a common scale while retaining the underlying differences in the range of values.
For example, Min-max normalization converts each value of the numeric column to a value between 0 and 1 using the formula
Normalized value = (NumericValue - MinValue) / (MaxValue - MinValue). A downside of Min-max Normalization is that it does not handle outliers very well.