breakpoint()

The breakpoint() function engages, configures, and changes the debugger program used in a script.
When a breakpoint is reached, it triggers a pause in the execution of the program, allowing the programmer to examine and debug the current state of the code. This feature can be very helpful in trying to figure out why something isn’t working correctly or getting an understanding of what is happening. With breakpoints, the programmer can step through the code line-by-line, and watch the output as they progress through the program.
Syntax
breakpoint()
First introduced in Python 3.7 via PEP 553, the breakpoint() function imports the pdb module. Earlier versions of Python required explicitly setting up a debugger using the following syntax:
import pdb; pdb.set_trace()
One reason the breakpoint() function was introduced was to make debugging more concise and type-friendly. Plus, it offers additional features like the ability to choose different debugging tools.
Common pdb Debugger Commands
The default is to work with pdb debugger. Here are some common commands used while debugging:
| Command | Expanded | Description |
|---|---|---|
h |
help | Print a list of available commands. |
s |
step | Execute the current line, stop at the first possible occasion (either in a function that is called or on the next line in the current function). |
n |
next | Continue execution until the next line in the current function is reached, or it returns. The difference between next and step is that step stops inside a called function, while next executes called functions, only stopping at the next line in the current function. |
c |
continue | Continue execution, only stop when a breakpoint is encountered. |
w |
where | Print a stack trace, with the most recent frame at the bottom, showing the code that is currently executing and its callers. |
l |
list | Show the current location in the file and a few lines (by default 11 lines) of context. |
q |
quit | Quit from the debugger. |
A full list of commands and more information are in the official documentation on Python’s website.
Example
Use breakpoint() to open the pdb debugger console:
print("Welcome to Codecademy!")breakpoint()print("Welcome back to Codecademy!!")
This will cause the following in the terminal:
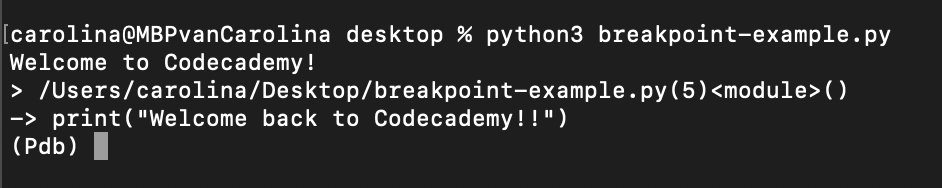
The execution of the program was paused, showing a prompt in the terminal. At this point, the code can be analyzed using the previously mentioned commands.
All contributors
- Anonymous contributorAnonymous contributor3071 total contributions
 christian.dinh2476 total contributions
- Anonymous contributorAnonymous contributor186 total contributions
 carocoda2 total contributions

- Anonymous contributor
- christian.dinh
- Anonymous contributor
- carocoda
Looking to contribute?
- Learn more about how to get involved.
- Edit this page on GitHub to fix an error or make an improvement.
- Submit feedback to let us know how we can improve Docs.


